Анимированная периодическая таблица Менделеева
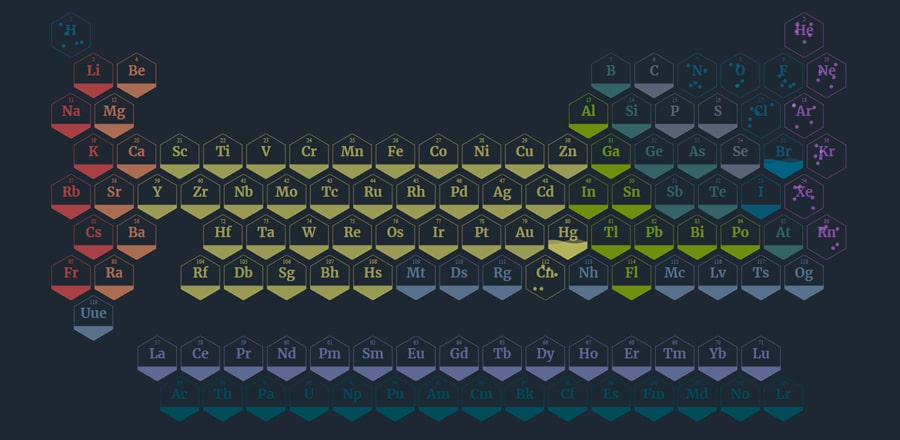
Анимация элементов периодической таблицы в зависимости от агрегатного состояния вещества: газообразное, жидкое или твердое.
HTML
<div id="container"></div>CSS
@import url("https://fonts.googleapis.com/css2?family=Merriweather:wght@700&display=swap");
body {
  margin: 0;
  justify-content: center;
  display: flex;
  background: #222831;
}

#container {
  width: 95vw;
  height: 55vw;
  background: #262c35;
  margin-top: 5vw;
  position: relative;
  border-radius: 5px;
  margin-bottom: 5vw;
}

.element-name {
  position: absolute;
  left: 50%;
  top: 40%;
  transform: translate(-50%, -50%);
  font-size: 1.5vw;
  font-family: "Merriweather", serif;
  font-weight: 700;
}
.element-number {
  position: absolute;
  left: 50%;
  top: 15%;
  transform: translate(-50%, -50%);
  font-size: 0.6vw;
}

.legend {
  position: absolute;
  left: 50%;
  top: 50%;
  transform: translate(-50%, -50%);
  font-size: 0.8vw;
  font-family: "Merriweather", serif;
  font-weight: 700;
}

.svg {
  width: 100%;
  height: 100%;
}
JS
Библиотекаhttps://cdnjs.cloudflare.com/ajax/libs/d3/6.3.1/d3.min.jslet elements;
const { PI, sin, cos, random } = Math;
const TAU = 2 * PI;
const range = (n, m = 0) =>
Array(n)
.fill(m)
.map((i, j) => i + j);
const map = (value, sMin, sMax, dMin, dMax) => {
return dMin + ((value - sMin) / (sMax - sMin)) * (dMax - dMin);
};
const polar = (ang, r = 1, [x = 0, y = 0] = []) => [
x + r * cos(ang),
y + r * sin(ang)
];
const container = d3.select("#container");
const setStyle = (el, attrs) =>
Object.entries(attrs).reduce((acc, [key, val]) => acc.style(key, val), el);
const setAttrs = (el, attrs) =>
Object.entries(attrs).reduce((acc, [key, val]) => acc.attr(key, val), el);
const clipCords = range(6).map((i) => {
const ang = map(i, 0, 6, 0, TAU);
return polar(ang + PI / 2, 50);
});
const clipPathD = `M${[...clipCords, clipCords[0]]
.map(([x, y]) => `L${x},${y}`)
.join("")
.slice(1)}`;
const svgRoot = container.append("svg");
setAttrs(svgRoot, { width: "0px", height: "0px" });
const defs = svgRoot.append("defs");
const clipPath = defs.append("clipPath");
setAttrs(clipPath, { id: "clipPath" });
const clipPathPath = clipPath.append("path");
setAttrs(clipPathPath, { d: clipPathD });
class Atom {
constructor(parent, color) {
this.element = parent.append("circle");
setAttrs(this.element, { cx: 0, cy: 0, r: 4, fill: `${color}88` });
this.seed1 = random() * TAU;
this.seed2 = random() * TAU;
}
updatePosition(t) {
const cx = 25 * sin(this.seed1 + t);
const cy = 25 * sin(this.seed2 + t);
setAttrs(this.element, { cx, cy });
}
}
class Element {
constructor(x, y, name, number, phase, color) {
this.root = container.append("div");
setStyle(this.root, {
width: "5vw",
height: "5vw",
transform: `translate(${x}vw, ${y}vw)`,
position: "absolute"
});
this.phase = phase;
this.svg = this.root.append("svg");
setAttrs(this.svg, { viewBox: "0 0 100 100", class: "svg" });
this.group = this.svg.append("g");
setAttrs(this.group, { transform: "translate(50,50)" });
this.border = this.group.append("path");
setAttrs(this.border, { d: clipPathD, fill: "none", stroke: `${color}88` });
if (phase === "Solid") {
this.solid = this.group.append("rect");
setAttrs(this.solid, {
x: -50,
y: 18,
width: 100,
height: 60,
fill: `${color}88`,
style: "clip-path: url(#clipPath)"
});
}
if (phase === "Liquid") {
this.liquidPathA = this.group.append("path");
setAttrs(this.liquidPathA, {
d: "",
fill: `${color}88`,
style: "clip-path: url(#clipPath)"
});
this.liquidPathB = this.group.append("path");
setAttrs(this.liquidPathB, {
d: "",
fill: `${color}44`,
style: "clip-path: url(#clipPath)"
});
}
if (phase === "Gas") {
this.atoms = range(5).map(() => new Atom(this.group, color));
}
this.name = this.root.append("div").text(name);
setAttrs(this.name, { class: "element-name" });
setStyle(this.name, { color: `${color}88` });
this.number = this.root.append("div").text(number);
setAttrs(this.number, { class: "element-number" });
setStyle(this.number, { color: `${color}88` });
}
update(t, path1, path2) {
if (this.phase === "Liquid") {
this.updateLiquid(path1, path2);
}
if (this.phase === "Gas") {
this.updateAtoms(t);
}
}
updateLiquid(path1, path2) {
setAttrs(this.liquidPathA, { d: path1 });
setAttrs(this.liquidPathB, { d: path2 });
}
updateAtoms(t) {
this.atoms.forEach((atom) => {
atom.updatePosition(t);
});
}
}
const categoryColors = {
"diatomic nonmetal": "#3d7ea6",
"noble gas": "#bc6ff1",
"alkali metal": "#f05454",
"alkaline earth metal": "#ffa36c",
metalloid: "#64958f",
"polyatomic nonmetal": "#8d93ab",
"post-transition metal": "#c0e218",
"transition metal": "#fcf876",
lanthanide: "#949cdf",
actinide: "#16697a"
};
function createElements(data) {
elements = data.map((element, index) => {
const category = element.category;
const name = element.symbol;
const number = element.number;
const phase = element.phase;
const ix = element.xpos;
const iy = element.ypos;
const x = ix * 4.8 + ((iy + 1) % 2) * 2.5 - 2;
const y = iy * 4.5 - 4;
const color = categoryColors[category] || "#93abd3";
return new Element(x, y, name, number, phase, color);
});
}
let step = 0;
function animate() {
step = (step + 1) % 100;
const t = map(step, 0, 100, 0, TAU);
const curve1 = range(10)
.map((i) => {
const ang = map(i, 0, 10, 0, TAU);
const x = map(i, 0, 10, -50, 50);
const y = 10 + 4 * sin(ang + t);
return `L${x},${y}`;
})
.join("");
const curve2 = range(10)
.map((i) => {
const ang = map(i, 0, 10, 0, TAU);
const x = map(i, 0, 10, -50, 50);
const y = 10 + 6 * sin(ang + t + PI);
return `L${x},${y}`;
})
.join("");
const path1 = `M50,10L50,50L-50,50L-50,10${curve1}`;
const path2 = `M50,10L50,50L-50,50L-50,10${curve2}`;
elements.forEach((element) => {
element.update(t, path1, path2);
});
requestAnimationFrame(animate);
}
fetch("https://assets.codepen.io/3685267/periodic-table-data.json")
.then((response) => response.json())
.then((data) => {
createElements(data.elements);
animate();
});